
Analytics 101 for Educators and Administrators
Data is everywhere these days, and there is a clear financial opportunity to turn complex information into actionable insights. Allied Market Research forecasts that insights from data will likely produce more than $100 billion in revenue worldwide by 2023. Colleges and universities need to consider how they can join this data economy, as fully harnessing their massive volumes of data can help schools address some of their biggest challenges, including student recruitment and retention, student engagement, curriculum optimization, university reputation, and overall costs. But before higher education institutions kick off complex data analytics programs, they need to take the time to establish a strategy and follow industry best practices.
Setting a Strategy
One of the most common mistakes made by companies starting analytics programs is to hire a data expert, shove him/her in front of a database, and expect magic to happen. Without a strategic plan, however, a lot of projects can fail.
Any higher education technology rollout needs to start with strategy. Decision-makers must define the issues they intend to explore and address with data. Objectives vary by university, but some of the common ones include improving student recruitment, boosting student retention, increasing revenue generated by donors and tuition, optimizing or personalizing curricula, bolstering reputation, and streamlining academic or business processes, such as financial aid document processing and awards.
Once problems are identified, organizations can choose how they want to measure outcomes. Key performance indictors (KPIs) are summary measurements of a goal that can be tracked over time to measure progress or improvement. Many times, these can be summarized visually or plotted on a graph that follows the measurement through a given time period.
Data Science and Business Intelligence
One of the biggest hurdles in getting started in analytics is sifting through the buzzwords and figuring out which tools best align with a university. Let’s go through some of the common buzzwords and define them.
- Business intelligence and data visualization refers to the process of analyzing data and presenting the information to stakeholders who can act on the insights. Typical targets include the definition and tracking of KPIs. In many cases, the reports comprise a dashboard of visualizations related to those KPIs.
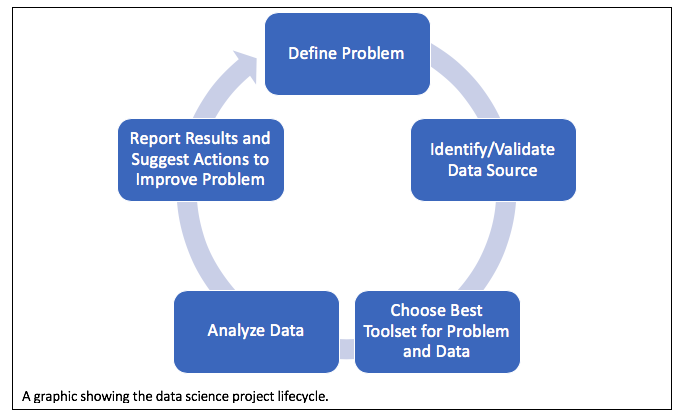
- Data science refers to the lifecycle of a data project, which typically includes defining a problem and how insights will be used, identifying a source of data, and either analyzing the data to gain insight or conducting an experiment to test different ways of solving the problem. For instance, a data scientist might examine how long it takes to deliver a financial aid award and determine its positive or negative impact on different types of students relying on financial aid to see if there are any inefficiencies that could be improved in the process.
- Machine learning refers to a set of algorithms commonly used by data scientists to model data. Some algorithms learn from existing data to predict an outcome of interest; for example, these algorithms (which include deep learning, regression, and random forest, among others) might have a set of demographic and academic factors as well as retention rates for a set of students. Algorithms learn from that dataset and can be used to predict retention for other students, perhaps the next incoming class of students. Other types of algorithms, like clustering algorithms, can group students or variables based on shared characteristics.
- Natural language processing (NLP) is another common buzzword. NLP includes tools to work with text data. A few examples include analyzing student comments for sentiment (positive or negative expression) or creating a chatbot, a type of artificial intelligence that can converse with students about a defined set of topics.
Towards Actionable Analytics
Identifying a tool that aligns with a school’s needs is one of the biggest challenges associated with leveraging analytics in higher education. Before you think about what toolset you should be even considering, you first need to:
- Define the problem that needs to be solved
- Identify and validate the data required to solve the problem
- Determine how results might be used
Insight based on data is powerful, but it will likely fail to introduce cost-saving or revenue-boosting capabilities if higher education institutions do not revisit processes or policies.
Once something actionable is identified within an analytics project, the next challenge involves designing a trial to test different solutions to the problem using data. One way to generate ideas is to review the published literature on the problem.
Understanding best practices and sifting through buzzwords to find the best analytics solutions can go a long way in deriving value from data.