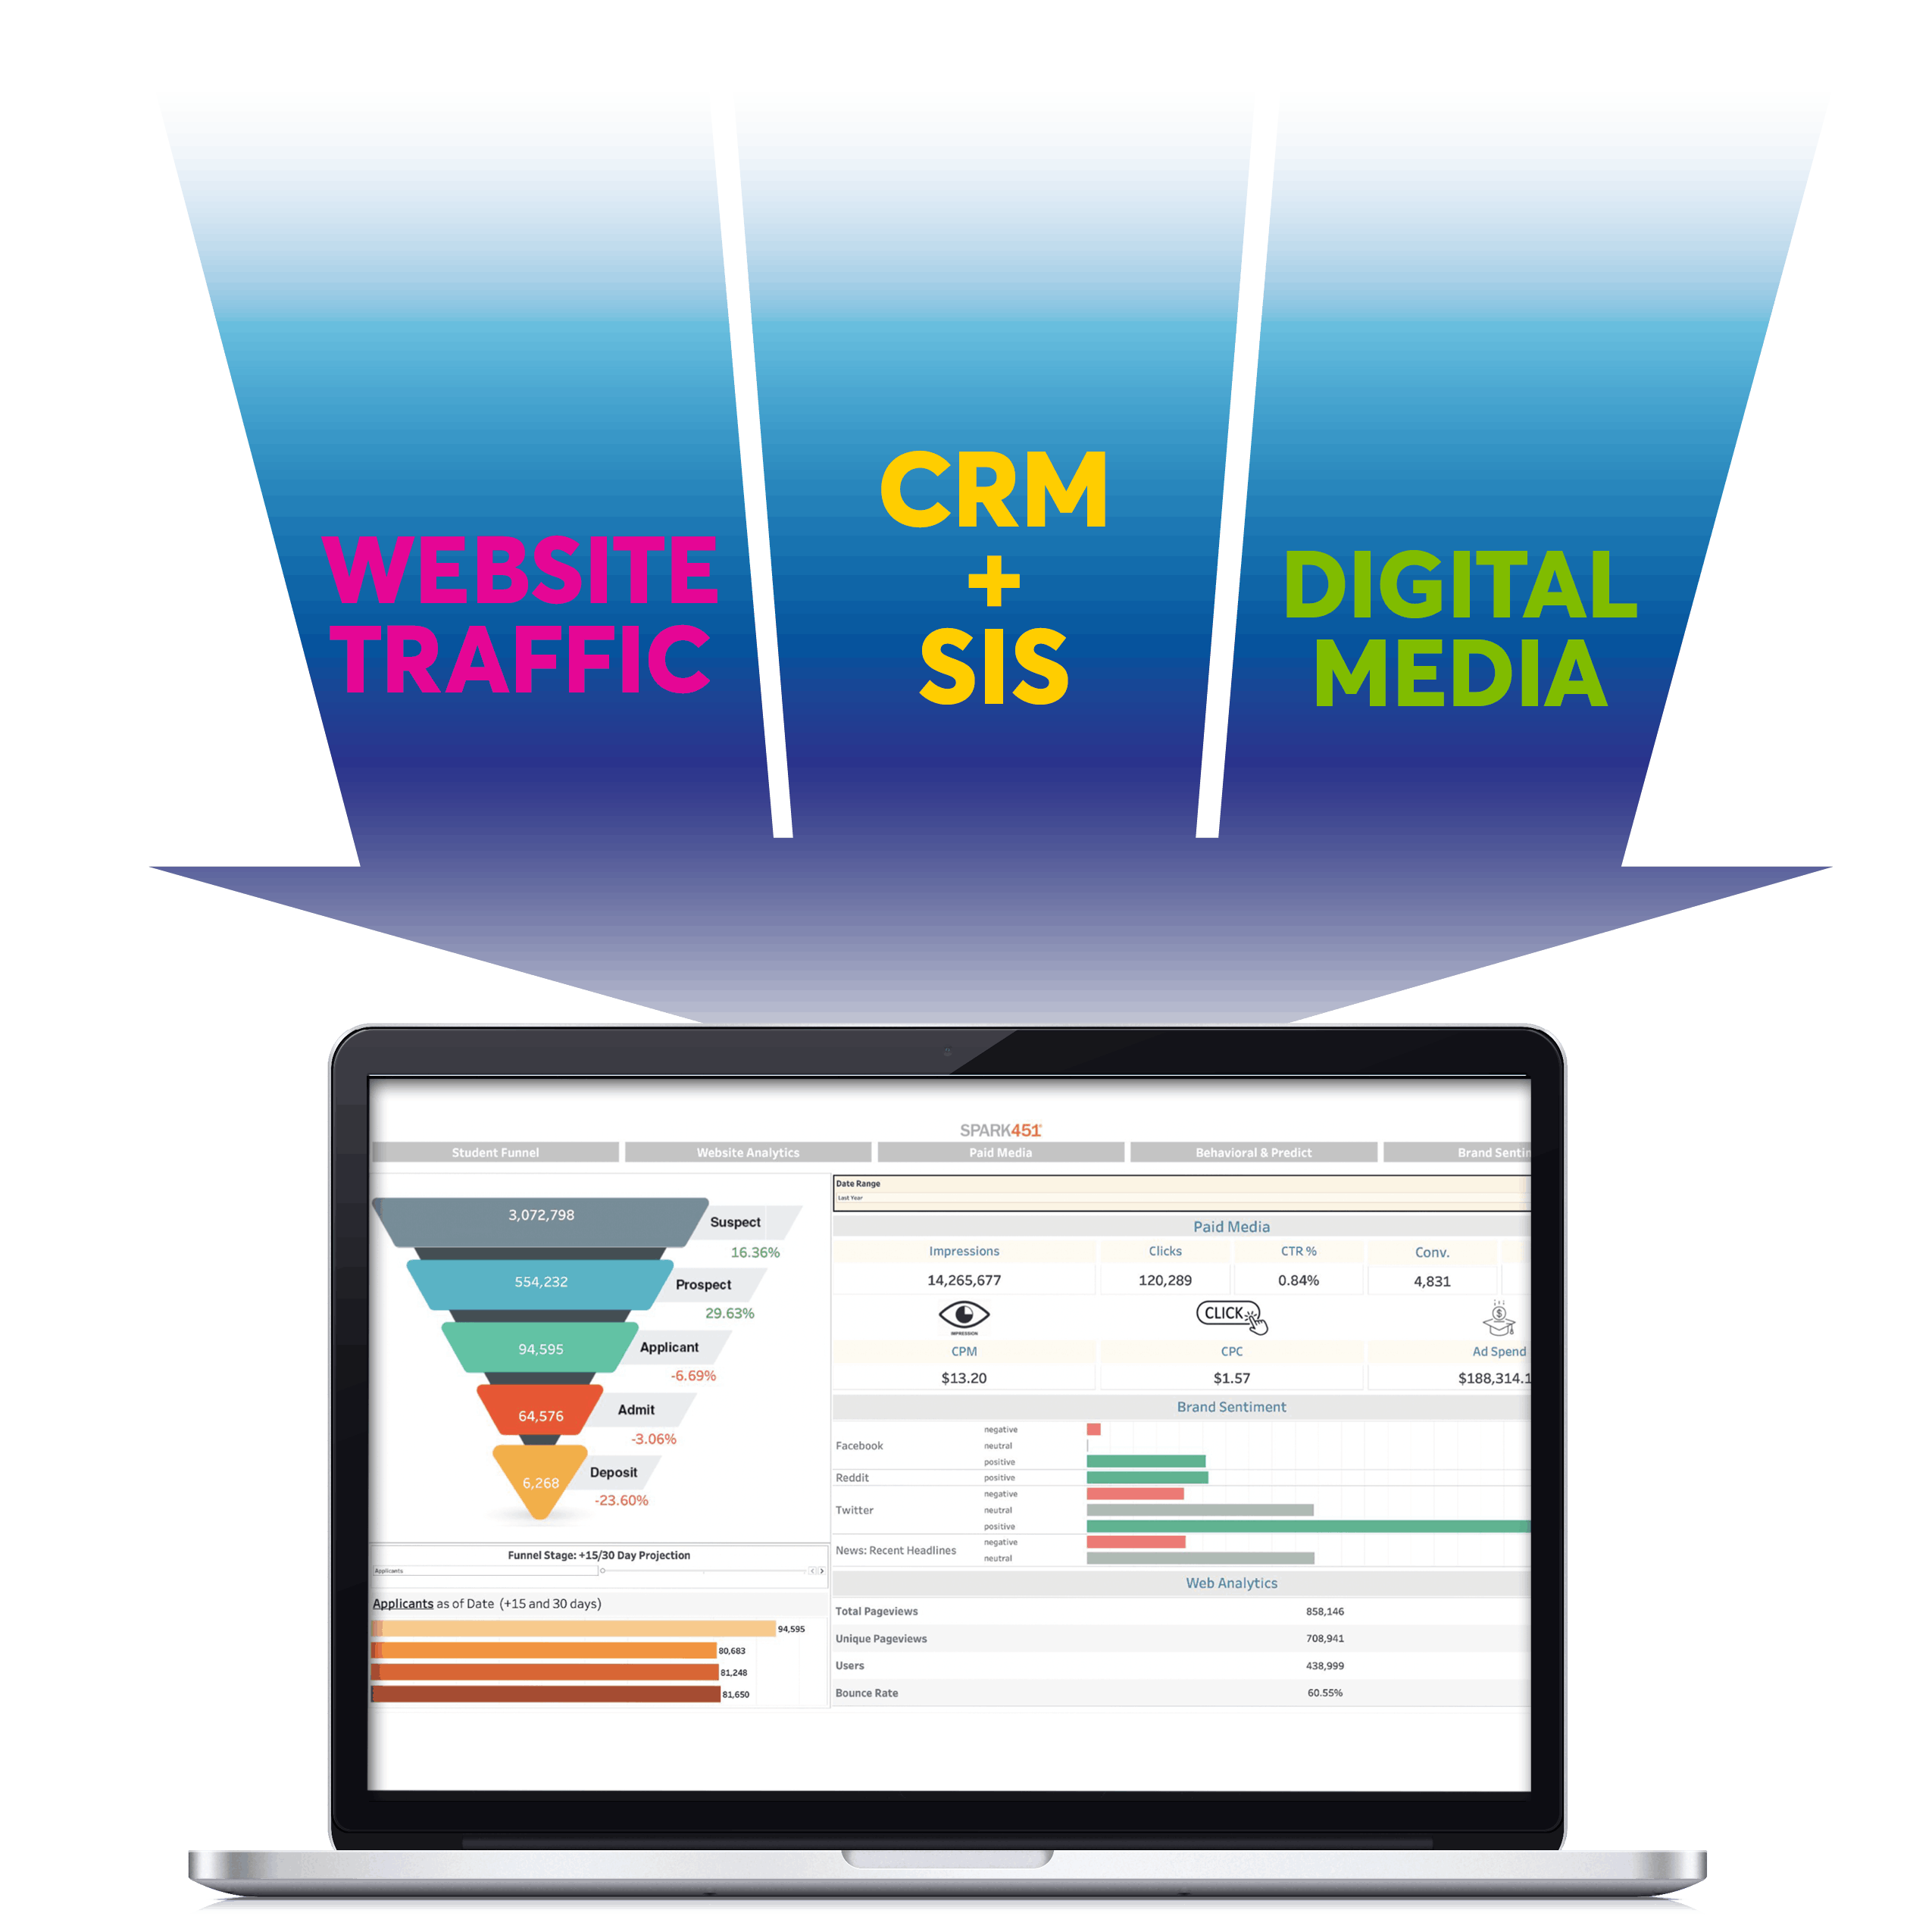
ROI-Boosting Intel
Combine marketing data and recruitment outcomes to determine which efforts are most worth your budget dollars.
Real-Time Insights
Keep up-to-the-minute info from all of your platforms at your fingertips.
Streamlined User Interface
Our attractive, highly navigable dashboard makes it easy to access and synthesize complex information.
Increased Efficiency
Make informed decisions more quickly, without having to cross-reference multiple portals and platforms manually.
Platform Agnostic
Seamlessly integrate data from virtually any CRM, SIS, website analytics platform, and paid social or digital media reporting site.
Marketing Analytics
Quickly identify discernible marketing optimization opportunities.


